In Self-serve choose ‘Analytics’
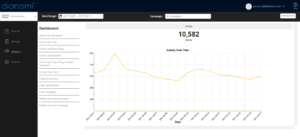
2. On the Dashboard you will be shown a graph of the number of clicks of all campaigns in the current month. You are shown the number of Actions and Clicks over the month. Towards the top of the page on the left is a Date Range option, from this you can choose a range of dates to view from a drop down list. On the right is a Product option, from this you can select a campaign to analyse. If you choose a Date or Product option, the graph and number of Actions and Clicks will change accordingly. To the right of the Product option is the ‘Download CVS’ button, this allows you to download the information to your computer in an Excel format. The ‘Download CVS’, Date Range and Product options are consistent throughout the different views in the Analytics section. On the left side of the page is a list of views within the Analytics section.

3. If you click on ‘Action by Ad Variant‘ on the left-hand side menu, you will see the performance metrics broken down by Ad Variant in a table. For each Ad Variant you will see the Campaign ID, Variant ID, Campaign Name, Image and Text for the Ad, Current Status of the campaign, Impressions (views) per campaign, Number of Click-throughs, The Score (which is an algorithmic score that takes into account the impressions, clicks, actions and cost that indicated the success of the campaign, higher the score the more successful the campaign), Valid Actions, Cost and Cost per Action. All these metrics can be put in ascending or descending order if you click on the table titles. Tip: use metrics to choose which Ad Variant is most successful and which variants to keep activated or to deactivate.

4. If you click on ‘Action by Device Type‘ on the left-hand side menu, you will see the performance metrics broken down by Device in a table. For all campaigns (unless you choose a product type from the drop down list) you will see the Computer Actions, Computer Clicks, Computer Action Rate, Tablet Actions, Tablet Clicks, Tablet Actions Rate, Mobile Actions, Mobile Clicks, Mobile Action Rate. All these metrics can be put in ascending or descending order if you click on the table titles.

5. If you click on ‘Action by Publisher‘ on the left-hand side menu, you will see the performance metrics broken down by Publisher in a table. For all campaigns (unless you choose a product type from the drop down list) you will see the Name of the Publisher, Number of Impressions, Number of Ad Clicks, The Ad Click through-rate (Ctr), Number of Actions, Conversion Rate, Cost per Ad. All these metrics can be put in ascending or descending order if you click on the table titles.

6. If you click on ‘Action by Time of Day in Client Timezone‘ on the left-hand side menu, you will see the performance metrics broken down by Time of Day in the client’s timezone. For all campaigns (unless you choose a product type from the drop down list) you will see a graph showing the action rate over a 24 hour period. Below the graph you will see a table showing you the Hour, clicks in the hour, Action in the hour and Action Rate in that hour. All these metrics can be put in ascending or descending order if you click on the table titles. Tip: use data to show performance at different times and then ask your Account manager to edit the day parting of the campaign.

7. If you click on ‘Action by code‘ on the left-hand side menu, you will see the performance metrics broken down by Time of Day in the client’s timezone code. For all campaigns (unless you choose a product type from the drop down list) you will see a table showing you the Action Code, Total Actions, Validated Actions. All these metrics can be put in ascending or descending order if you click on the table titles.

8. If you click on ‘Activity over time‘ on the left-hand side menu, you will see the performance metrics broken down by interactions with your ad campaigns by day. For all campaigns (unless you choose a product type from the drop down list) you will see a graph showing all activity (interactions) over a selected period of time. Below the graph is a table showing you the Date, Leads per date, Clicks per date, Actions per day and price per date. All these metrics can be put in ascending or descending order if you click on the table titles. Tip: use data to show performance on different devices and then edit creative features of the campaign for the device you are targeting.

9. If you click on ‘Click by Country‘ on the left-hand side menu, you will see the click metrics broken down by country. For all campaigns (unless you choose a product type from the drop down list) you will see a pie chart showing the percentage clicks broken down by country. Below the graph is a table showing you the country and the number of clicks. All these metrics can be put in ascending or descending order if you click on the table titles. Tip: use data to show performance in different countries and then edit creative features of the campaign for the countries you are targeting.

10. If you click on ‘Click by publisher‘ on the left-hand side menu you will see the click metrics broken down by publisher. For all campaigns (unless you choose a product type from the drop down list) you will see a pie chart showing the percentage clicks broken down by publisher. Below the graph is a table showing you the publisher and the number of clicks. All these metrics can be put in ascending or descending order if you click on the table titles.

11. If you click on ‘Click by region‘ on the left-hand side menu, you will see the click metrics broken down by geographical region. For all campaigns (unless you choose a product type from the drop down list) you will see a pie chart showing the percentage clicks broken down by region. Below the graph is a table showing you the region and the number of clicks. All these metrics can be put in ascending or descending order if you click on the table titles. Tip: use data to show performance in different regions and then edit creative features of the campaign for the target audience in a region.

12. If you click on ‘Performance by Ad Variant‘ on the left-hand side menu, you will see the performance metrics broken down by Ad Variant in a table. For each campaign, you will see the Campaign ID, Variant ID, Campaign Name, Image and Text for the Ad, Current Status of the campaign, Impressions (views) per campaign, Number of Clicks, Price, Click-through rate and The Score (which is an algorithmic score that takes into account the impressions. All these metrics can be put in ascending or descending order if you click on the table titles. Tip: use metrics to choose which Ad Variant is most successful and which variant to keep activated.

13. If you click on ‘Performance by Ad Campaign‘ on the left-hand side menu, you will see the performance metrics broken down by Campaign in a list. For each campaign you will see the Campaign Image, Campaign Name, The Product Name/Brand, The Campaign Keywords, current Status of the campaign, Impressions (views) per campaign, Number of Clicks, Price, Click-through rate (%Ctrx1000) and The Score (which is an algorithmic score that takes into account the impressions. All these metrics can be put in ascending or descending order if you click on the table titles. Tip: use metrics to choose which Ad Variant is most successful and which variant to keep activated.